
Stage-Gate-Modell
Schnelle Antwort
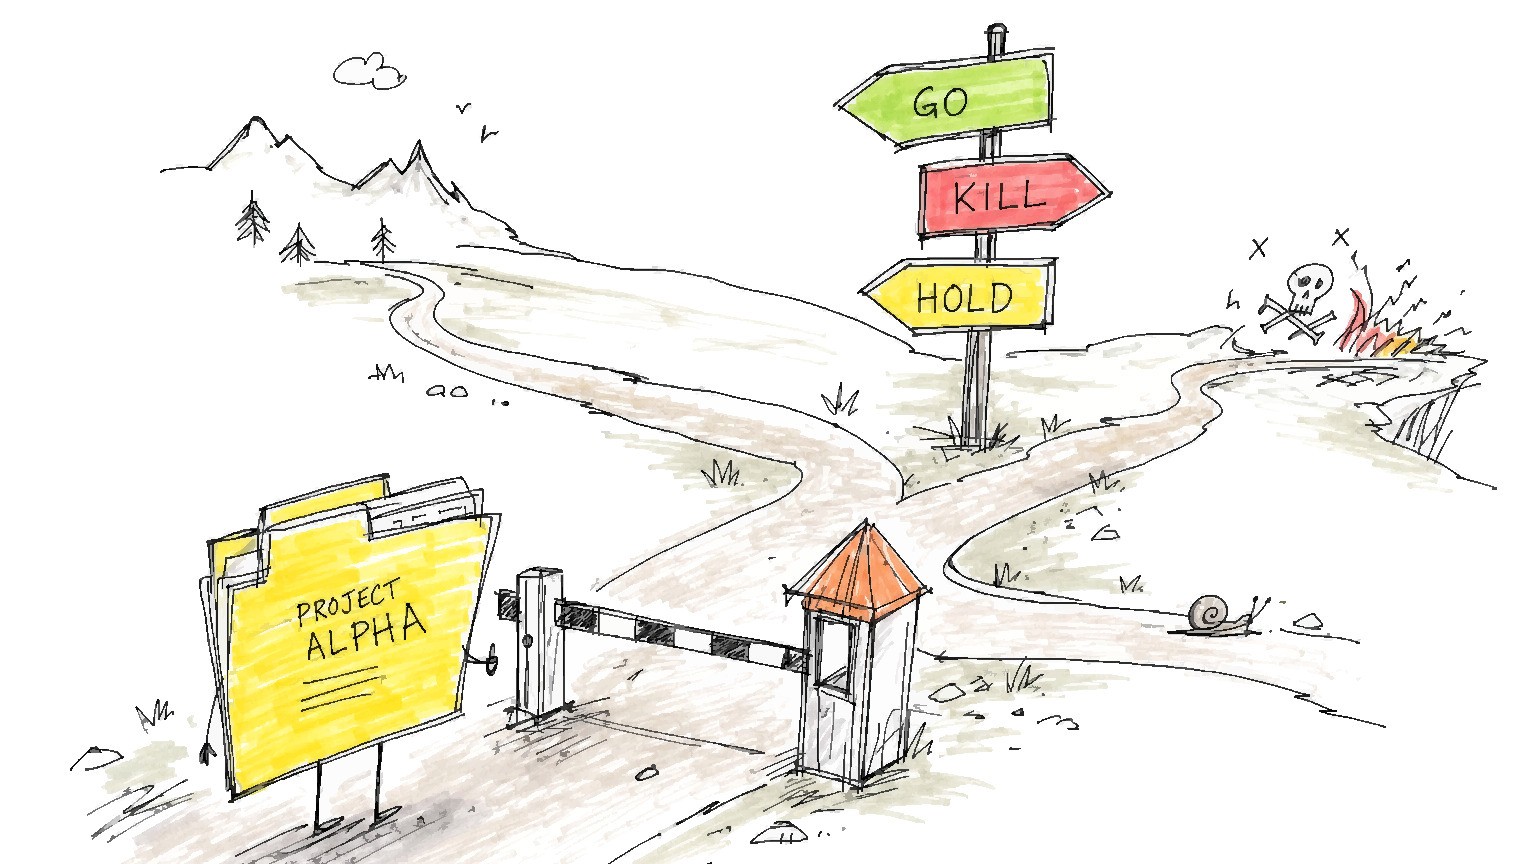
Das Stage-Gate-Modell unterteilt die Entwicklung neuer Produkte in Arbeitsphasen, die durch Go/Kill-Entscheidungspunkte getrennt sind. Erfahren Sie mehr über die 5 Phasen, Gate-Kriterien und warum die meisten Implementierungen scheitern.
Robert G. Cooper formalized the stage-gate model in 1986, drawing on a study of 252 new product launches across 123 firms. The model moves a concept from idea to market through alternating work phases (stages) and go/kill investment decisions (gates), with a senior management panel evaluating evidence at each gate before deciding whether to fund the next stage. Now in its fifth generation, it integrates agile sprints and AI decision support without abandoning its core investment-discipline logic.
TL;DR
- Stage-Gate divides new product development into work stages separated by go/kill decision gates, where senior management decides whether to fund the next phase.
- Robert G. Cooper developed the model from empirical research on 252 product launches. It is now in its fifth generation, with AI tools and agile sprints integrated into stage execution.
- Gates are investment decisions. Four outputs exist: Go, Kill, Hold, Recycle. Organizations that default to Go at every gate have failed to implement Stage-Gate.
- High-performing Stage-Gate organizations kill 30–50% of concepts before Development and another 10–20% before Launch. Kill rate is the best proxy for whether an implementation is functioning.
- Stage-Gate favors incremental innovation structurally. its gate criteria are designed for projects with legible financial models. Transformational bets require parallel mechanisms.
- Cooper's 2026 version integrates 40+ AI tool categories across stages and introduces dynamic gates. Only 28% of firms had adopted AI for NPD as of 2025.
In brief: Stage-Gate's value is in the kills. Any project calendar can sequence work. Only Stage-Gate, implemented with gatekeepers who have real kill authority, concentrates resources on projects the evidence actually supports.
What is the Stage-Gate model?
The stage-gate model is a new product development framework that moves product concepts from idea to launch through a series of work phases (stages) separated by management decision checkpoints (gates). Gates are investment decisions: a cross-functional panel evaluates evidence against predefined criteria and decides whether the project warrants funding for the next stage.
Robert G. Cooper, drawing on 252 new product launches across 123 industrial firms, described the original intent as an entrepreneurial guide, not a paper form-filling exercise, as Cooper explains in his own words.
The model is also called the phase-gate process. Phase-gate is a generic term for any structured process using phases and decision gates. Stage-Gate is Cooper's specific trademarked implementation, owned by Stage-Gate International / Product Development Institute. In practice, practitioners use both terms interchangeably. The PDMA defines Stage-Gate as "a widely employed product development process that divides the effort into distinct time-sequenced Stages separated by management decision Gates."
Stage-Gate is an investment-discipline framework. The stages give project teams structured time to reduce uncertainty before each funding decision. Gates are where senior management decides whether that uncertainty has been reduced enough to justify the next tranche of spending. If a project cannot meet the gate's criteria, the gate should kill it. Whether organizations actually use the mechanism is a different question, addressed at length in §5 and §7.
What it is not: The surface resemblance to waterfall is misleading, as Cooper (2008) documented. Waterfall mandates a fixed sequential path with no decision branching and no exit mechanism. Stage-Gate's gates produce four possible outputs (Go, Kill, Hold, Recycle) with no waterfall equivalent, and Stage-Gate permits overlapping stages under time pressure. The governance logic is different despite the shared vocabulary of sequential phases. §6 and §8 cover that distinction in full.
Where did Stage-Gate come from?
Stage-Gate emerged from Cooper's empirical research in the 1980s, but its governing logic has roots in aerospace and defense procurement that predate Cooper's work by two decades.
The pre-Cooper roots
NASA formalized a phase-gate process in 1972 under document NHB 7121.2, implementing guidelines designed to "provide, through defined phases, an adequate basis for management decisions" on capital-intensive space missions. The Department of Defense developed similar phase-gate logic for defense procurement through the late 1960s. In both cases, the underlying logic was the same: break high-stakes capital allocation into stages, with explicit decision points between stages where evidence is reviewed before the next tranche of funding is authorized.
This regulated-industry lineage matters. It explains why Stage-Gate's gate criteria feel more like regulatory milestones than project milestones. The model was designed for contexts where the cost of a wrong decision late in development is catastrophic. Cooper adapted that logic for commercial new product development.
Cooper's NewProd studies
Cooper did not derive Stage-Gate from theory. He built it from data. His NewProd research program analyzed 252 new product histories across 123 industrial firms, identifying the activity patterns that distinguished successful new products from failures. The framework's stage structure reflects which activities, completed at which sequence points, most reliably predicted commercial success.
Cooper introduced the first formal Stage-Gate system in 1986, and a 1990 Business Horizons paper established it as a peer-reviewed NPD framework. By 2010, 88% of U.S. firms with formal NPD processes were using Stage-Gate or a variant.
Evolution to the fifth generation
Cooper has updated the model through five generations. Key changes at each transition:
- Second generation (early 1990s): Formal gate criteria added. portfolio management integration introduced.
- Third generation (late 1990s): Conditional gate decisions introduced. spiral development within stages.
- Fourth generation (NexGen, 2008): Explicit acknowledgment that Stage-Gate had calcified into bureaucracy in many organizations. reemphasis on entrepreneurial intent and lean gate designs, documented in Cooper's 2008 JPIM paper.
- Fifth generation (2016–2026): In-stage Scrum sprints. dynamic gates. AI decision support across all NPD stages, detailed in Cooper's 2026 PDMA update.
The model's authority comes from this 40-year empirical lineage. Each generation updated based on observed implementation failures, not theoretical refinement.
What are the 5 stages of Stage-Gate?
The stages exist to reduce uncertainty in a structured sequence before each funding decision. Teams produce specific types of evidence that gate criteria will evaluate — the stages are not milestones to complete but evidence-generation phases whose outputs earn or lose funding.
Cooper's model includes six stages. Stage 0 (Discovery) is the front-end funnel: teams generate and scope candidate concepts, often using continuous foresight practices, without committing significant resources. Stage 1 (Scoping) is a rapid preliminary assessment producing a scoping report against which Gate 1 applies. Stage 2 (Build Business Case) is where the most consequential uncertainty reduction happens — teams complete the financial model, market validation research, and technical feasibility assessment. Stage 3 (Development) is full product development, ending with a tested prototype or working build. Stage 4 (Testing and Validation) runs final validation against launch criteria. Stage 5 (Launch) is full commercialization, with a post-launch review gate that closes the cycle, as defined in Cooper's 2026 PDMA post.
On stage numbering: Cooper labels Discovery as Stage 0 and the gates as Gate 1 through Gate 5. Implementations vary — six stages in some organizations, three in smaller ones. What matters is whether each stage end triggers an actual gate decision.
Stage 0 and Gate 1: where most ideas should die
Discovery is the front-end funnel — the fuzzy front end (the pre-gate period of speculative idea exploration before a concept enters the formal Stage-Gate process) — deliberately wide. Gate 1 is the first investment decision and, in well-functioning implementations, the highest-kill gate. A Gate 1 review takes 15–30 minutes. Concepts that fail a quick strategic-fit check against predefined must-meet criteria should die here, cheaply.
Cooper frames the attrition logic as a poker game:
"when you sit down at the poker table and you start betting, you don't put all your money on the table. You put maybe 2$ or 2€, and you get a few cards. And then you bet a little bit more money, and you get a few more cards and more information." — Robert G. Cooper
The funnel shape is intentional: roughly 60 ideas for every successful product launch, per Cooper's own funnel data.
Stage 2: the expensive stage
The Build Business Case stage produces the deliverable that Gate 2 evaluates against financial projections, market attractiveness, and competitive advantage. Teams may use a Business Model Canvas or equivalent structured framework to model the financial case. Projects authorized through Gate 2 receive Development funding, typically the largest single resource commitment in the process.
A weak business case that passes Gate 2 creates a Development investment in a project that cannot succeed, as Cooper's PDMA research makes clear. Gate 2 is where the cost of approval failure is highest.
How does a gate review actually work?
A gate review is an investment committee meeting. The project team presents evidence. the gatekeepers evaluate against predefined criteria. the panel makes a funding decision. The question at every gate is not "have you done the work" but "does the evidence justify continued investment at the next stage," per Stage-Gate International's gatekeeping research.
A gate review has three components. First, deliverables in: what the project team presents — research findings, financial analyses, and the stage-specific outputs produced since the last gate. Deliverables must be completed before the gate meeting; the meeting evaluates them, it does not receive them for the first time. Second, gate criteria: the evidence standards against which deliverables are evaluated. Third, gate outputs: the panel's funding decision.
Gate criteria come in two types. Must-meet criteria are binary yes/no knockouts — failing "does not violate regulatory requirements" kills the project automatically, with no scoring override. Should-meet criteria are scored 0–10 and weighted; a low aggregate score may trigger a kill if it falls below threshold, with "competitive advantage of the product" as a typical example. Grönlund, Sjödin, and Frishammar (2010) distinguish these as criteria that "weed out misfit projects quickly" (must-meet) versus criteria "used to prioritize the remaining projects" (should-meet).
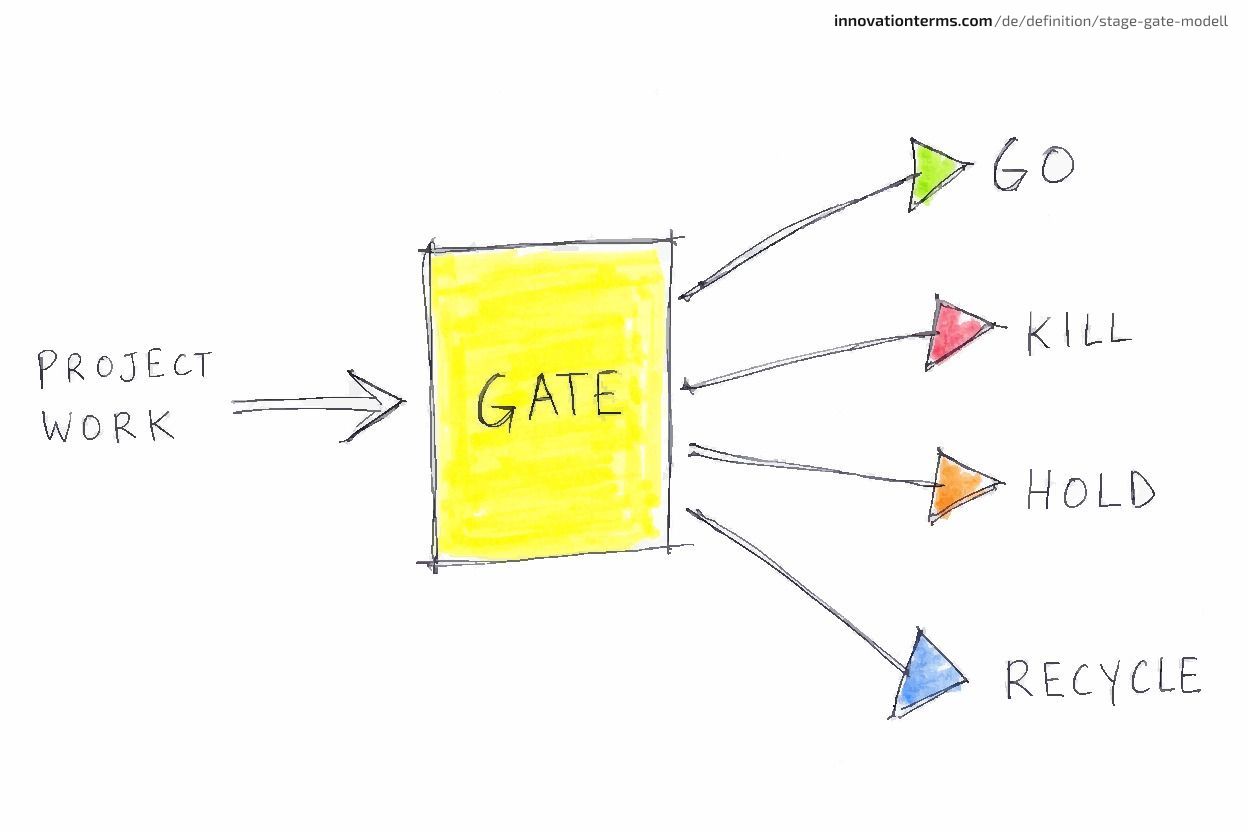
Gate outputs are four possible decisions:
- Go: Fund the next stage. Resources committed and personnel assigned.
- Kill: Terminate the project. Resources freed for other projects.
- Hold: Pause pending new information. Time-limited, with a specific reconvene trigger.
- Recycle: Rework the current stage and re-present with stronger evidence.
Hold and Recycle are frequently confused with each other and with Kill. Hold is time-gated: the project sits until a specific condition is met (a regulatory ruling, a technology milestone). Recycle sends the team back to work with identified gaps. Kill ends the project. Most rubber-stamp gate systems never distinguish between these outputs because every meeting ends with Go.
VBS scorecard design
Cooper's Value-Based Scorecard applies six criteria across two categories. The ordering is deliberate: Strategic Fit is evaluated first because it is binary and can be assessed in minutes. Financial Reward is evaluated last because it is speculative and expensive to model accurately, as described in Stage-Gate International's gatekeeping post. The scorecard ordering is falsification logic: the cheapest-to-evaluate, highest-kill-power criteria appear first, so projects failing them die before consuming more gate time and resources.
Gatekeeper authority
Cooper specifies that gatekeepers must have resource-allocation authority. Advisory input does not qualify. If the gatekeeper panel can recommend a kill but cannot execute it, the gate is theater.
Thomas Zurbuchen, NASA's former Head of Science, describes the authority requirement: "I listen to everybody, but at the end, it's my decision. In previous jobs I've had, when a decision is made by the leader, the discussion starts. When my decision is made, it's over," as recorded in the HBR IdeaCast. The organizational design question for Stage-Gate implementation: who must be in the room, and what authority level justifies the investment decision being made? Senior business unit leaders or equivalent, not project managers, not functional advisors.
Stage-Gate by the Numbers
Adopting Stage-Gate does not produce improvement; running functioning kill gates does. The 88% adoption statistic measures presence, not practice. It tells you how many organizations bought Stage-Gate. It does not tell you how many are using it. The number that matters is kill rate. Most organizations do not track it, per Cooper's 2026 PDMA analysis.
| Metric | Number | Source | What it measures |
|---|---|---|---|
| US adoption rate | 88% | APQC benchmarking, 2010 | How widely Stage-Gate is used |
| Global adoption rate | 54% | PDMA global study | Cross-industry penetration |
| Cycle time reduction (high performers) | ~30% | Cooper/Edgett benchmarking | NPD speed vs. unstructured process |
| Kill rate, high performers | 30–50% before Development | APQC high-performer analysis | Front-end gate rigor |
| Additional kills before Launch | 10–20% | APQC high-performer analysis | Back-end gate rigor |
| Performance gap | Bottom 20% show 3.5× failure rate of top 20% | APQC benchmarking | Discrimination between effective and ineffective Stage-Gate |
| Late-stage kill cost reduction | 40–60% within 2 years | ITONICS practitioner research | Impact of disciplined gate committee structure |
High-performing Stage-Gate organizations kill 30–50% of projects before Development (APQC benchmarking via Umbrex), and another 10–20% before Launch. Average adopters kill far fewer.
The bottom 20% of Stage-Gate businesses show more than 3.5× the failure rate of the top 20% (Umbrex synthesis of APQC data) — not because the model differs across these groups, but because kill discipline does.
The 88% adoption figure, deployed without kill-rate context, is precisely the framing that conflates process adoption with process discipline. High adoption without kill discipline proves only that a lot of organizations are holding gate meetings that end with Go.
What do most organizations get wrong about Stage-Gate?
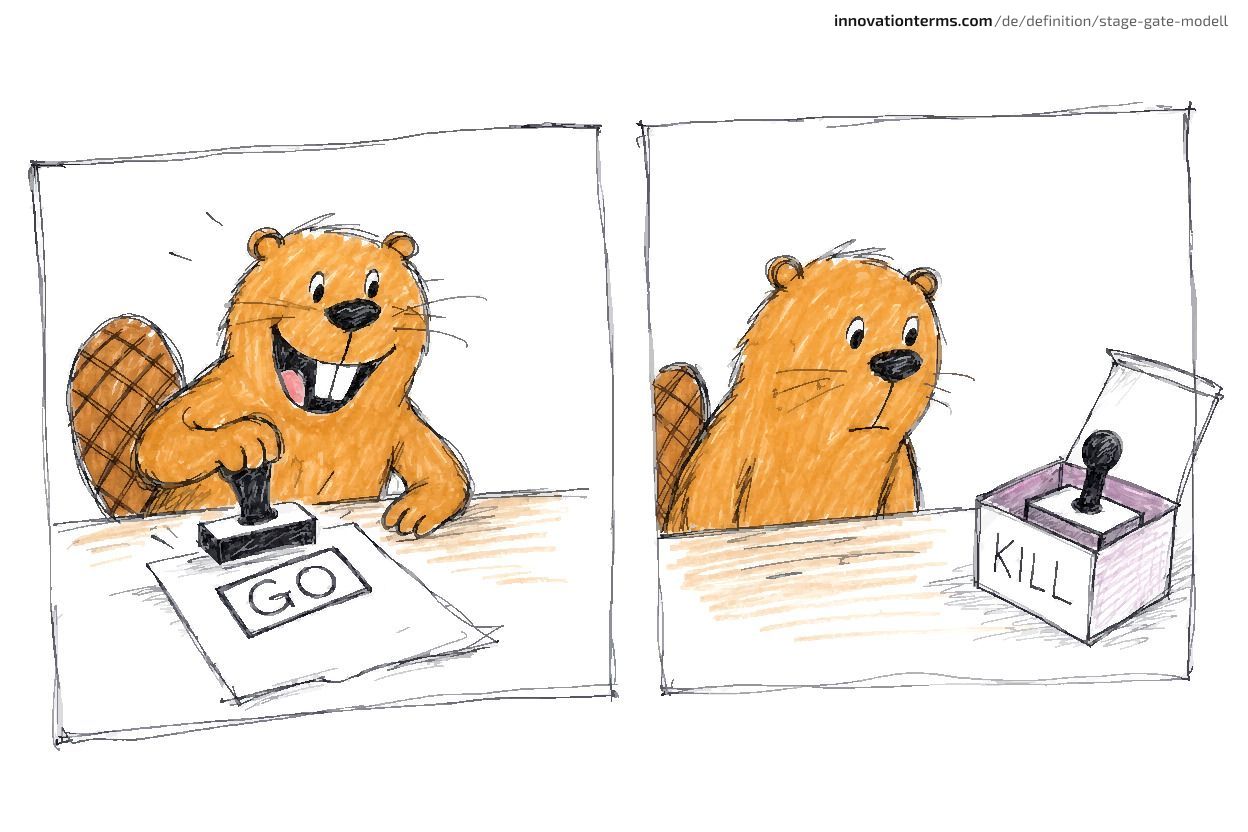
The most common Stage-Gate failure is implementation capture: organizations adopt the stages, schedule gate meetings, generate scorecards, and then approve every project at every gate. The model is correctly designed; the implementation abandons its function.
Misconception 1: "Stage-Gate is just waterfall with checkpoints."
Waterfall mandates a fixed sequential path with no decision branching. Stage-Gate's gates are investment decisions with four possible outputs (Go/Kill/Hold/Recycle); waterfall has no equivalent structure. Stage-Gate also permits overlapping stages under time pressure. The stage names make the two models look similar; the governance logic underneath is different, as Cooper (2008) demonstrated. A waterfall project can fail to deliver. Stage-Gate should kill projects that cannot succeed before they deliver anything.
Misconception 2: "Passing a gate means the project is on track."
Passing a gate means the project survived the investment decision. If gatekeepers lack kill authority or treat gate meetings as progress reviews, passing a gate signals nothing except that the next meeting has been scheduled. Baxter et al. (2022) document empirically that Stage-Gate gates can "become rubber stamps or roadblocks when governed by functional silos or politics rather than evidence-based investment decisions."
Misconception 3: "Gate criteria are a compliance checklist."
Compliance checklists produce outputs: documents, signatures, completed forms. Gate criteria produce a decision. The distinction is whether the gatekeeper panel can, and does, say no. Cooper's label for gates where Kill is never decided: "gates without teeth," per Umbrex's synthesis of Cooper's research. Toothless gates preserve the administrative overhead of Stage-Gate while eliminating its control function.
Misconception 4: "Stage-Gate slows projects down."
Early kills eliminating expensive late-stage failures are how Stage-Gate reduces NPD cycle time by approximately 30%, per Cooper/Edgett benchmarking. The perceived slowness is an artifact of gate-design failures — documentation overhead that the model itself does not require.
"a process designed with the best intentions often ends up thwarting innovation because it's so cumbersome, so bureaucratic, so painful to get through." — Robert G. Cooper
Cooper is describing what happens when organizations implement Stage-Gate wrong, not what Stage-Gate is. The bureaucratic version is a departure from the original model's intent.
Why the kill function is Stage-Gate's real value
Most companies that say they use Stage-Gate are running a stage-review model. They complete every stage. They hold gate meetings. They almost never kill projects. The result is a process that costs as much as Stage-Gate and delivers as much as a status meeting. A process that never kills is not a decision system. It is a calendar dressed up as governance.
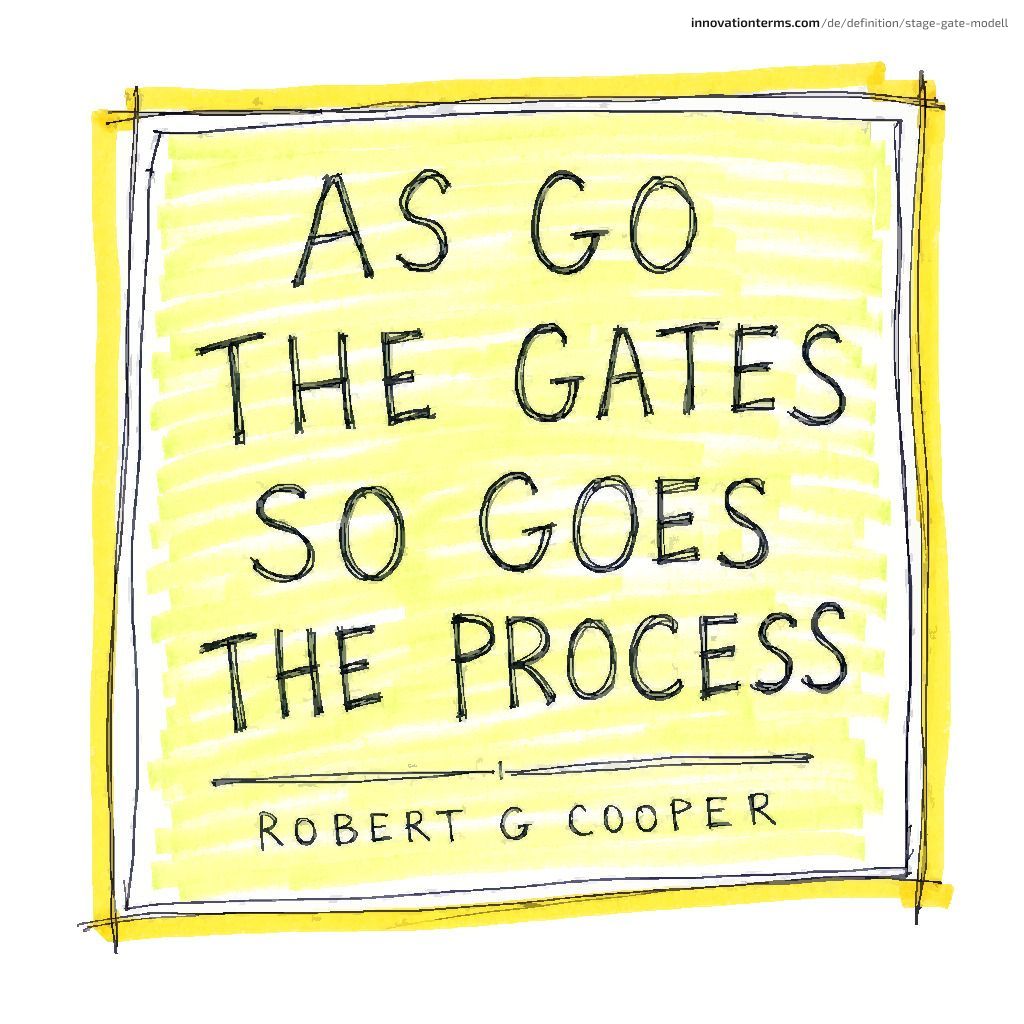
"As go the Gates, so goes the Process." — Robert G. Cooper, Stage-Gate International
Gate quality determines process quality. A Stage-Gate system with functioning gates is an investment discipline that concentrates resources on the strongest projects. A Stage-Gate system with rubber-stamp gates is an expensive project calendar with periodic meetings.
The investment-committee model
Gate panels should function as investment committees. The project team presents evidence; gatekeepers evaluate against predefined criteria; the decision is Go, Kill, Hold, or Recycle. Cooper's 2026 PDMA post states the principle directly:
"Gates are not mere status reviews...they are where resource commitments are made!" — Robert G. Cooper, PDMA 2026
This framing changes two things. First, it changes who belongs in the room: people with budget authority, not subject-matter advisors who can only recommend. Second, it changes what counts as success at a gate meeting: a clear decision, including a kill, is a success; an approval with unresolved concerns is a failure.
What APQC's high performers do differently
What Stage-Gate International's gatekeeping research surfaces is a kill-rate gap. High performers eliminate 30–50% of concepts before Development and another 10–20% before Launch, per APQC benchmarking. Not because they begin with superior ideas, but because front-end gate discipline is where they differ from average organizations.
Kill rate as a health KPI
An organization that kills fewer than 10% of projects across all gates has a dysfunctional gate system, provided the front-end funnel is generating at least 30–40 concepts per year. The diagnostic is less useful for organizations gating fewer than 10 projects annually, where low kill rates may reflect legitimate upstream filtering rather than rubber-stamp governance. For organizations with adequate funnel volume, the evidence points to a different driver: ITONICS practitioner research documents that "the kill rate gap was driven by champion presence at portfolio review meetings rather than program quality." Gates become rubber stamps because everyone has invested too much to quit. That is sunk-cost bias, not superior upstream filtering, as Baxter et al. (2022) confirm empirically.
The governance fix: "Stage-gate decisions should be made by a committee of 3 to 5 named decision makers, none of whom is the program champion, who then apply pre-committed criteria," per ITONICS. Companies implementing this structure see late-stage kill costs drop 40–60% within two years.
Obi Felten, formerly Head of Getting Moonshots Ready for Contact with the Real World at X (Alphabet), describes the organizational design that makes kill decisions work:
"they had essentially hit what they called their kill criteria. And they came to me and they said, we should shut this project down. And therefore the decision to shut the project down came from them." — Obi Felten, formerly of X (Alphabet), People I (Mostly) Admire, ep. 111
This is the inverse of the common failure mode. Rather than teams advocating for continuation while management rubber-stamps approval, the team brings the kill decision upward when their own predefined criteria are met. This model requires kill criteria to be set in advance and the team to be willing to execute against them without lobbying for continuation.
How does Stage-Gate compare to waterfall and agile?
Stage-Gate governs portfolio investment decisions. Agile governs sprint execution within a stage. Organizations that frame them as alternatives are misidentifying what each mechanism does.
| Dimension | Waterfall | Stage-Gate | Agile |
|---|---|---|---|
| Primary job | Sequential task execution | Portfolio investment discipline | Iterative delivery within a scope |
| Scope flexibility | Fixed at start | Adjustable at each gate | Continuous through backlog |
| Failure mechanism | Late-stage discovery | Kill at gate before next-stage investment | Sprint retrospective |
| Decision authority | Project manager | Senior management gatekeepers | Product owner + team |
| Kill mechanism | Rare; project restart | Explicit gate output | Pivot or abandon at sprint boundary |
| AI integration (2026) | Minimal | Active (40+ tools per Cooper's 2026 update) | Native (co-pilot tooling) |
The false choice
The "Stage-Gate vs. agile" debate has largely missed Cooper and Sommer's 2016 JPIM paper and the fifth generation documentation, leaving the argument anchored to an outdated version of the model. Cooper explicitly integrates in-stage Scrum sprints into Stage-Gate's development stages. As he describes it, the project is "taking some of the principles of Agile and building them into an already successful Stage-and-Gate process," per Cooper.
The hybrid appeared in the literature in 2015, when Sommer et al. documented seven Danish manufacturing companies running the model: "Combining Stage-Gate models, at the strategic level, with the Agile method Scrum, implemented at the tactical level, can improve product development performance." The question facing practitioners is not which to choose. It is how to design the boundary correctly.
What agile cannot replace in Stage-Gate
A sprint review can identify that a product direction is not working. That finding does not come with authority to act on it. A gate decision can kill the project and reallocate its budget to a competing project, which requires organizational authority that sits well above the sprint team. Sprint cycles create faster innovation feedback loops within each stage, but they cannot substitute for the portfolio-level kill function.
Cooper and Sommer (2016) frame the opportunity: "Agile–Stage-Gate hybrids may be the most exciting change to new-product processes since gating systems emerged 30+ years ago." The hybrid assigns each job to the mechanism built for it. Agile handles sprint execution. Stage-Gate handles investment governance.
What does Stage-Gate do to your innovation portfolio?
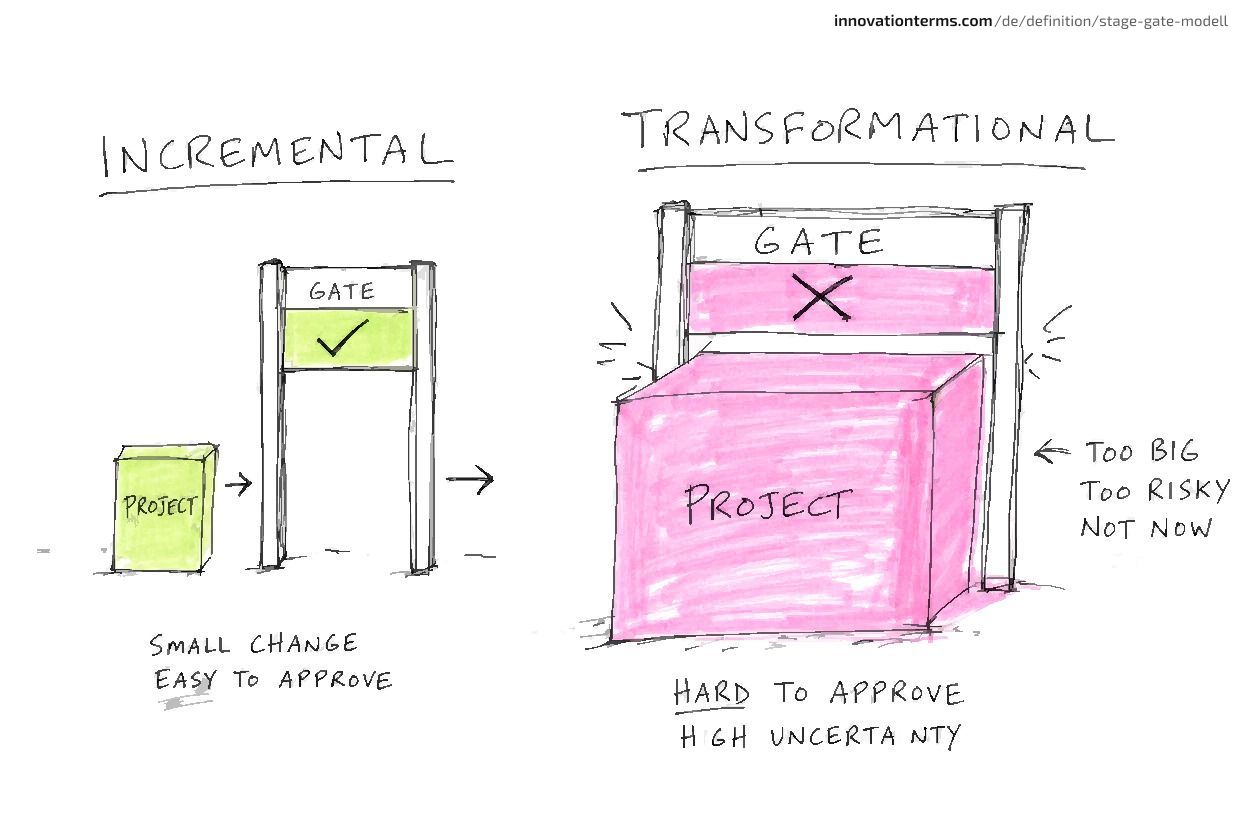
Stage-Gate's criteria reward legible futures: financial projections, market-size validation, technical feasibility. Incremental bets arrive with evidence. Transformational bets — including bets on the innovator's dilemma — arrive with possibility. A genuinely novel product cannot produce validated market-size data at Gate 1. That is not a failure of research. It is the nature of the new. The criteria are not broken. They are being applied beyond their design envelope, as Sethi & Iqbal (2008) demonstrate empirically.
Why gate criteria favor incremental innovation
Must-meet criteria require clear regulatory compliance and established feasibility. Should-meet criteria weight financial projections, competitive advantage, and market attractiveness. Each criterion evaluates evidence that exists for incremental projects and cannot exist for transformational ones at early stages.
Sethi and Iqbal (2008) find that "Stage-Gate controls have the potential of restricting learning in a new product development project and thus hurting the performance of novel new products." Their empirical finding is that the gate's binary evaluation logic is systematically biased against novel products whose evidence is necessarily incomplete. A Gate 2 review asking "do you have a validated business case" will eliminate transformational projects that cannot yet produce that evidence, not because the projects are weak but because the evidence structure does not fit them.
Baxter et al. (2022) argue the incremental bias is a gatekeeper behavior problem rather than a criteria-design problem. The distinction matters, but Cooper's own remedy points to criteria: his recommendation is separate Stage-Gate tracks with different gate-criterion sets for incremental and transformational projects, per Cooper's portfolio research. You do not redesign the criteria if the problem is the gatekeepers. The evidence structure is the culprit.
The portfolio skew effect
Portfolio skew is predictable, as Baxter et al. (2022) document. Organizations relying exclusively on Stage-Gate weight their portfolios toward lower-risk, shorter-horizon projects because the model was designed for capital-intensive physical product development with knowable financial models. In VUCA environments characterized by rapid market shifts, this conservatism compounds. No modification for a different context means the tool's native biases show up directly in the portfolio mix.
Tendayi Viki (Strategyzer) identifies the organizational mechanism that reinforces this structural bias: middle management faces internal pressure from the top to deliver near-term results, which drives them to approve projects with visible ROI at gates. Stage-Gate's criteria accommodate that bias; they do not counter it unless deliberately configured otherwise.
What to do about it
Cooper's own recommendation: run separate Stage-Gate tracks with different gate criteria for incremental and transformational projects, per his portfolio guidance. The portfolio management integration in Stage-Gate's third generation introduced "strategic buckets" (pre-committed resource pools, divided by project type or risk level, that determine how much of the portfolio budget is available to each category before individual projects compete at gates) for this purpose, allocating a defined percentage of resource capacity to transformational bets before the gate process begins. Without deliberate bucket allocation, Stage-Gate's default criteria systematically favor the incremental.
Open innovation platforms serve as a second mechanism. By sourcing external innovations through mechanisms like wisdom of the crowd and external partner networks at earlier validation stages, organizations reduce the in-house evidence burden that Stage-Gate's gate criteria create for genuinely novel products. P&G's Connect+Develop program (§12) demonstrates this in practice.
What does an agile Stage-Gate hybrid actually look like?
The agile Stage-Gate hybrid keeps the gate structure intact, replacing within-stage waterfall task sequences with sprint-based iterations. Governance unchanged. Gates still make go/kill decisions, and sprint teams determine how to produce the evidence those decisions will evaluate.
The Cooper hybrid design
Cooper and Sommer (2016) and Cooper's 2026 PDMA post describe the integration mechanics. Each stage runs as a series of sprints, typically 3–4 weeks each. Stage-end deliverables are reframed as sprint targets: the team knows from stage start what the gate will evaluate, and sprints are designed to produce that evidence iteratively. Gate criteria adjust to accept iterative evidence (working prototypes rather than final specifications) while the gate panel retains full go/kill authority.
Cooper on sprint applicability by stage:
"we can break the development phase into a series of 3-week or 4-week sprints in which you have to deliver something at the end of that, and not a PowerPoint presentation. Those principles can be applied to the development phase (stage 3) and the testing phase (stage 4)." — Robert G. Cooper
The constraint: sprints work best in stages with physical or demonstrable deliverables. Discovery and Scoping (Stages 0–1) are harder to sprint-ize because early-stage uncertainty reduction often requires sequential research before iterative delivery becomes meaningful.
Named examples
Sommer et al. (2015) documented seven Danish manufacturing companies running the hybrid. Lead author Anita Sommer is a senior consultant at The LEGO Group, where the implementation was developed. The LEGO hybrid integrates Scrum sprints at the tactical level within Stage-Gate governance at the strategic level. Five documented benefits across the studied companies: faster response to changing requirements, enhanced team communication, quicker time-to-market, higher team morale, and better validation of product assumptions through sprint-level demonstrations.
Cooper and Sommer's 2018 follow-up studied six major manufacturing firms adopting the hybrid and documented "significant improvements in both time to market and productivity" alongside predictable implementation challenges, management skepticism and resource allocation difficulties during the transition period.
The choice of variant depends on who makes the kill decisions and whether they have organizational authority to execute them. A sprint team cannot kill a project and reallocate a $4M budget. A senior management gatekeeper panel can.
When does Stage-Gate work, and when does it fail?
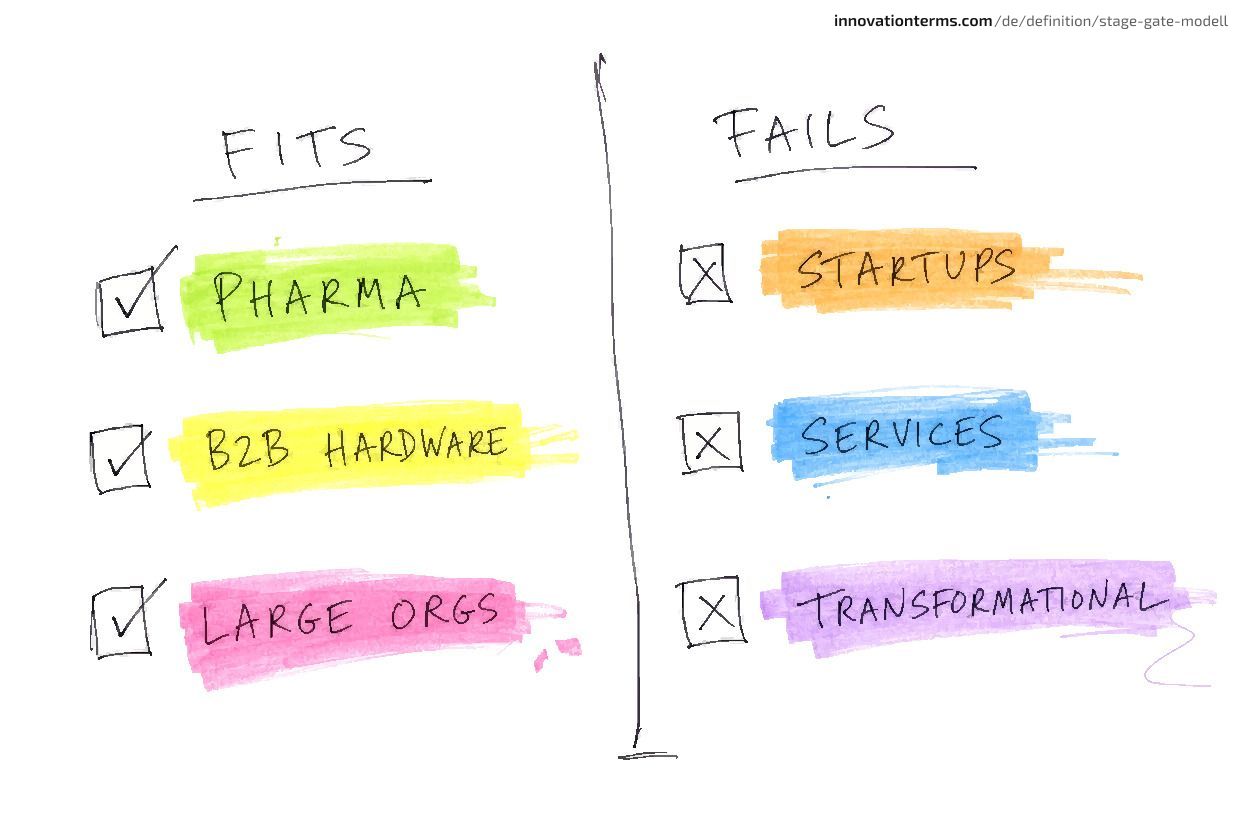
Stage-Gate was designed for capital-intensive physical product development. It assumes large capital commitments, knowable financial models, and senior gatekeepers with real budget authority. Apply it unchanged to services or transformational innovation and you carry all the overhead while losing the advantage it was designed for. The worst implementations keep the meetings and lose the kills. The question is not whether Stage-Gate fits your context; it is which criteria and gate structure you need to redesign before you run it.
Where Stage-Gate performs best
Pharma and regulated industries. FDA's IND/NDA pathway maps directly onto Stage-Gate:
| Stage-Gate | FDA phase |
|---|---|
| Stages 0–1 | Preclinical research |
| Stage 2 | Phase I trials |
| Stages 3–4 | Phase II and III trials |
| Gate 5 | NDA submission |
Pharma firms running internal Stage-Gate alongside FDA milestones operate two interlocking gate systems, per Stage-Gate International. Internal gates handle competitive kill decisions. FDA gates handle regulatory go/no-go. The dual-track structure creates more rigorous decision support than either system alone.
Manufacturing, B2B hardware, aerospace. Capital intensity creates natural alignment with Stage-Gate's investment-decision logic. The gate authorizes the next tranche of spending; high capital expenditure at each stage makes that authorization meaningful and costly if wrong.
Large or federated organizations. Stage-Gate provides a common decision language across R&D, marketing, manufacturing, and finance. The cross-functional gatekeeper panel is where competing organizational priorities get resolved against predefined criteria rather than in informal negotiations.
Where Stage-Gate underperforms
Startups and small companies. The documentation requirements consume a disproportionate share of a small team's bandwidth. Cooper acknowledges this and recommends a 3-gate Express version for smaller organizations, preserving the kill discipline without the overhead, per his 2026 guidance.
Service industries. Gate criteria built around physical prototype evidence require substitution. Services can run Stage-Gate, but the evidence vocabulary must be redesigned: pilot service deployments replace prototype testing; customer journey validation replaces product validation testing.
Transformational innovation, including the innovator's dilemma. Early-stage uncertainty cannot be resolved by the types of evidence Stage-Gate's standard criteria require. The portfolio-skew argument from §9 applies most strongly here. Transformational bets require parallel mechanisms alongside Stage-Gate.
Software and digital adaptation
Large software organizations have adapted Stage-Gate by substituting working software builds and user-testing evidence for physical deliverables at gates. Gate criteria are rewritten around customer validation evidence (retention, task completion rates, qualitative research) and technical risk reduction metrics. The governance structure is identical; the evidence vocabulary is different, as documented in Cooper (2008).
Cooper's own warning on rigid implementations: "If it's not agile and adaptive.. chances are it's going to kill bolder innovation." The risk of Stage-Gate in digital and software contexts is forcing digital evidence into criteria designed for physical product validation.
As Cooper observed, many NPD problems "can be directly traced to: too many projects not enough resources to do them properly." The gate function exists to solve this by killing weak projects and freeing capacity. Implementations that never kill make the resource crunch permanent regardless of industry.
Mini-case: P&G Connect+Develop and Stage-Gate with open partners
Context. By the early 2000s, Procter & Gamble had 7,500 scientists and engineers working in-house. More than 90% of its innovations were developed entirely internally. R&D productivity was plateauing. CEO A.G. Lafley set a target: 50% of innovations involving external partners by 2010, as documented by Grönlund, Sjödin & Frishammar (2010).
The problem. The criteria were built for internal evidence. Gate 1 and Gate 2 assumed internally verified technical feasibility, internally modeled financial projections, and P&G-owned IP. An externally sourced innovation arriving with partner data, uncertain IP status, and co-development dependencies had no path through those gates because the criteria were not designed to evaluate that type of evidence.
P&G faced a structural mismatch: the investment discipline of Stage-Gate required evidence that external partners could not provide in the format the existing criteria specified. The organization could either abandon the Stage-Gate governance structure or redesign the criteria to fit the co-development context. They chose the latter, per Grönlund et al.'s California Management Review analysis.
The adaptation. P&G redesigned Gate 1 and Gate 2 criteria for co-development. Modified must-meet criteria included IP ownership verification and partner technical capability assessment. Should-meet criteria added co-development milestone alignment and knowledge-sharing agreement terms. External innovations entered at Stage 1 as "co-development projects" with a modified evidence requirement tailored to what external partnerships could actually provide at each gate.
Grönlund, Sjödin, and Frishammar (2010) document this model in the California Management Review as the "open Stage-Gate model," observing that it requires gate criteria redesign without gate structure redesign. None of it changed. Stages, gate positions, gatekeeper authority, and the four-output decision logic all stayed exactly as Cooper had defined them. The specific criteria changed.
The outcome. By 2006, more than 35% of P&G innovations came from external sources, up from approximately 15% in 2000. The Pringles Prints innovation launched in under one year versus P&G's typical two-year development cycle: an external manufacturing partner had already completed Stage 1 and 2 uncertainty reduction that P&G would otherwise have done internally, allowing the project to enter Stage-Gate at a later gate. These outcomes are documented in Grönlund et al.'s review of the Connect+Develop model. The case also illustrates how invention capability can be distributed across an open innovation ecosystem rather than concentrated in-house.
How is Stage-Gate evolving in 2026?
Cooper's fifth generation Stage-Gate redesigns the gate as a dynamic decision point supported by AI-generated evidence.
The fifth generation changes
Cooper's February 3, 2026 PDMA post documents the current model. Eight changes from prior generations:
- In-stage Scrum sprints. Waterfall task sequences replaced with sprint-based iterations within stages.
- Dynamic gates. Plans and product definitions can pivot mid-stage as new evidence emerges, rather than being fixed at stage start.
- AI decision support. 40+ AI tool categories deployed across NPD stages for market analysis, voice-of-customer synthesis, competitive intelligence, and financial modeling.
- AI agentic systems. Automated research and analysis agents deployed at Discovery and Scoping stages.
- Parallel processing. Overlapping stages with explicit synchronization gates replace purely sequential execution.
- Sustainability scorecards. Eco Stage-Gate criteria integrated into gate evaluation.
- Portfolio tailoring. Streamlined pathways by project type; incremental and transformational projects follow different gate-criterion sets.
- Post-launch governance. Formal post-launch review gates replace informal retrospectives.
What AI does not change
Only 28% of US and EU firms were using AI for NPD tasks as of 2025, despite the commercial availability of Stage-Gate AI tools across all stages, per Stage-Gate International. Early AI adopters report 50% reductions in development times. Cooper (2023) has described AI as "the 10th milestone in NPD, and will likely have more impact on NPD than the combined effect of the other nine."
The gate decision remains a human organizational decision. AI tools can sharpen the evidence quality presented at gates, but they leave the gatekeeper panel intact and do not resolve who holds kill authority.
An AI-assisted rubber-stamp gate is still a rubber-stamp gate. The fifth generation makes the evidence better; it does not make the gatekeepers braver. Cooper's 2026 update reinforces rather than revises this thesis. Gates are investment decisions. The quality of that decision depends on the authority and willingness of the people making it. A gate is only as rigorous as the people willing to say no. Technology changes the inputs. Courage changes the outcome.
"if you're interested in innovation inside your company, you should be looking around and asking, are we creating innovation theater or are we actually delivering innovation?" — Steve Blank, Coaching for Leaders, ep. 761
AI-generated evidence presented at a rubber-stamp gate produces higher-quality theater. The diagnostic remains the same. Audit the last 24 months of gate decisions. If fewer than 10% of projects were killed, the gates are rubber stamps regardless of how good the evidence quality is.
Frequently asked questions
What are the 5 stages of the Stage-Gate model?
The standard model includes Stage 0 (Discovery: idea generation and preliminary scoping), Stage 1 (Scoping: rapid preliminary assessment), Stage 2 (Build Business Case: detailed investigation and customer validation), Stage 3 (Development: full product development), Stage 4 (Testing & Validation: final market and product validation), and Stage 5 (Launch: full commercialization). Each stage ends with a gate review where senior management decides whether to fund the next stage. Some implementations compress to three stages for smaller organizations, per Cooper's 2026 PDMA post.
What is the difference between Stage-Gate and phase-gate?
Stage-Gate is a trademark owned by Stage-Gate International, referring to Cooper's specific implementation. Phase-gate is the generic name for any structured process using phases and decision gates. The two terms describe the same operational model and are used interchangeably across industries and the academic literature, making the distinction organizational rather than practical.
What are the go/kill decision options at a stage-gate review?
Four options: Go (fund the next stage and commit resources), Kill (terminate the project and free resources for other projects), Hold (pause pending new information, with a specific reconvene trigger), and Recycle (rework the current stage and re-present with stronger evidence). Most organizations default to Go. A gate system where Kill is never selected has failed its primary function, per Stage-Gate International's gatekeeping research.
Does Stage-Gate work for startups?
Not in its standard 5-stage form. The documentation requirements consume a disproportionate share of a small team's capacity. Cooper's own guidance recommends a 3-gate Express version for smaller organizations, preserving kill discipline without the bureaucratic overhead. For early-stage startups where the product hypothesis is genuinely uncertain, lean startup's customer development approach — alongside methods like design thinking — typically replaces Stage-Gate because it evaluates different types of evidence at earlier stages.
What is the difference between Stage-Gate and agile?
Stage-Gate governs portfolio-level investment decisions: whether to fund the next phase. Agile governs sprint-level execution: how to build within a phase. They solve different problems at different organizational levels. Leading firms run both simultaneously, using agile sprints within Stage-Gate stages while maintaining gate authority at the senior management level, as documented by Cooper and Sommer (2016).
How do I know if our Stage-Gate is working?
Audit the last 24 months of gate decisions. If fewer than 10% of projects were killed, the gates are rubber-stamp reviews. High-performing Stage-Gate organizations kill 30–50% of concepts before Development, per APQC benchmarking. Secondary indicators: are gate decisions made by people with resource-allocation authority? Do must-meet criteria actually kill projects? The real question is whether "conditional go" language has drained them of meaning, turning every gate into an effective Go regardless of what the team delivered.
What is the biggest criticism of Stage-Gate?
Two main criticisms, targeting different failure modes. First, gate criteria favor incremental innovation: financial modeling, market size validation, and technical feasibility assessments are better suited to projects with legible financial futures than to transformational bets, producing portfolios skewed toward line extensions, as Sethi & Iqbal (2008) demonstrate. Second, rubber-stamp implementation: organizations adopt the stages without internalizing the kill function, producing administrative overhead without portfolio discipline, per Baxter et al. (2022). Both criticisms are valid. Both point to different remedies.

Clara @cla_reinholt
Beschäftigt sich mit Innovationskommunikation, -moderation und dem Umwandeln von Rahmenwerken in Teamgewohnheiten.